

Universal Debug Engine (UDE)
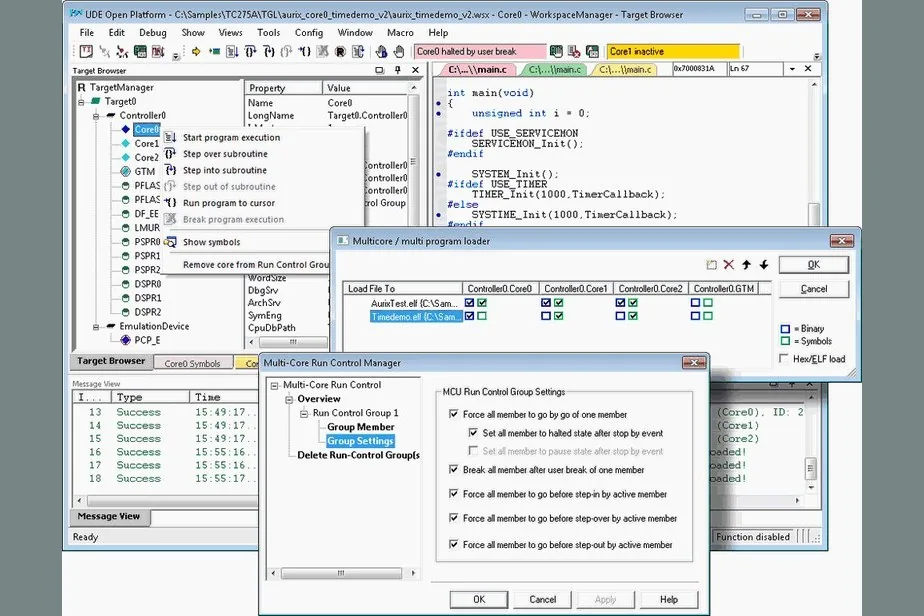
Universal Debug Engine (UDE) is PLS's multicore-capable integrated debug, trace, and test environment (software). It supports an extremely wide range of cores, including Infineon AURIX/TriCore, NXP/ST Power Architecture (MPC56/57/58, SPC56/57/58), Arm Cortex-M/R/A, Renesas RH850, RISC-V, ARC, SuperH SH-2A, STM32, Stellar, and S32.
 DEBUG · Debug probes / on-chip debugging
Overview
Universal Debug Engine (UDE) is PLS's multicore-capable integrated debug, trace, and test environment (software). It supports an extremely wide range of cores, including Infineon AURIX/TriCore, NXP/ST Power Architecture (MPC56/57/58, SPC56/57/58), Arm Cortex-M/R/A, Renesas RH850, RISC-V, ARC, SuperH SH-2A, STM32, Stellar, and S32.
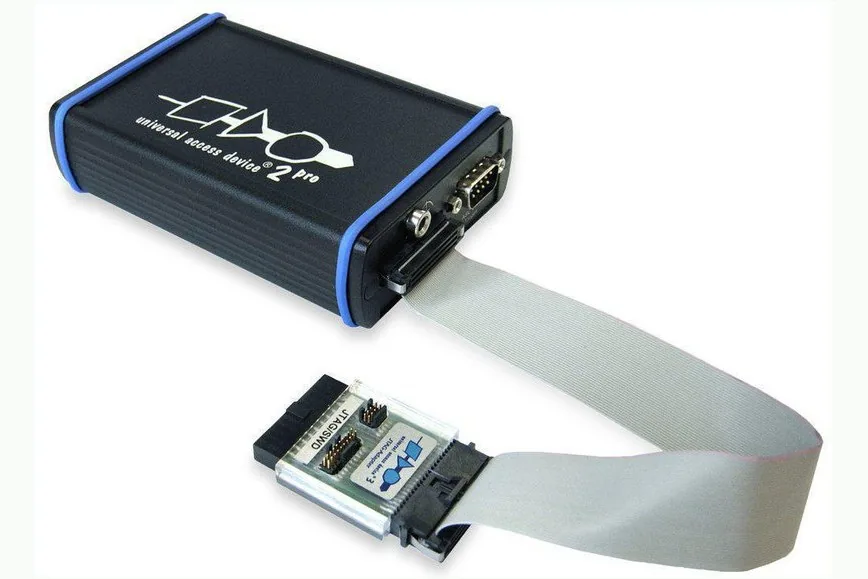
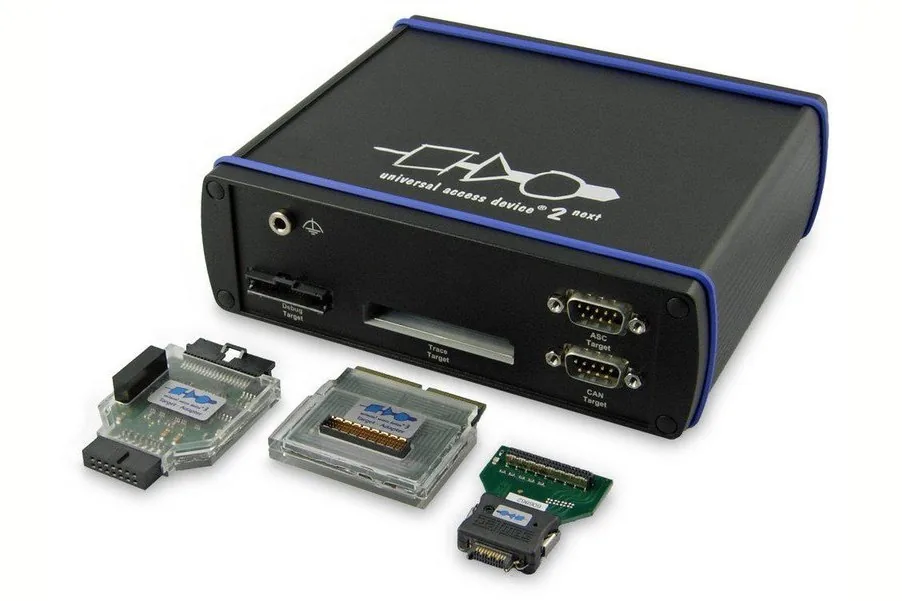
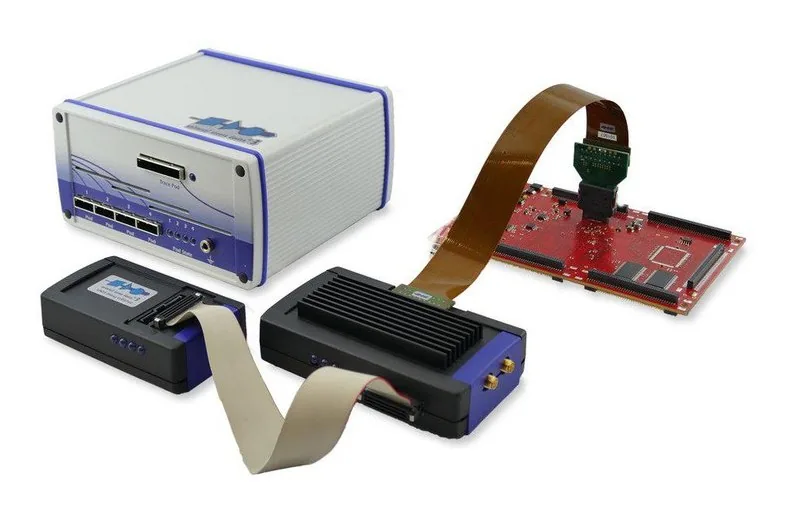
Target access is through the separately sold UAD family of access devices (three models: UAD2pro / UAD2next / UAD3+). Choose among the three according to use, budget, and trace requirements.
[Main new features in UDE 2024] cDSP debugging and SOTA support for AURIX TC4x, trace support for TRAVEO T2G/XMC7000 and RH850/U2B, integration of UDE SimplyTrace with RTOS Awareness (task trace), miniMCDS support (TC38x etc.), and floating-point display in trace. Supported RTOSes: SAFERTOS / FreeRTOS / PXROS-HR / MicroC/OS-II / AUTOSAR.
[Learning UDE from videos] PLS's webinar series (co-hosted with Hitex) explains UDE's main functions with live demos. Under “Learning UDE from videos” below we summarize five of them — trace-based analysis, an overview of the tools, Python automation, Arm Cortex-A/R multicore debugging, and variable visualization — so you can grasp the key points without watching.
Multicore debug and test environment. Supports advanced debugging of TriCore/AURIX and more.
Positive ONE Group supports you in Japanese, from product selection and quotes through to technical support during deployment, and proposes the optimal configuration for your target MCU, OS, quantity, and application.
Key specifications
| Type | Integrated debug, trace, and test environment (software) |
|---|---|
| Supported cores | AURIX/TriCore, Power, Cortex-M/R/A, RH850, RISC-V, ARC, SH-2A, and others |
| Features | Multicore debugging, trace, code coverage, test automation |
| Expansion | RTOS Awareness, MCDS/SimplyTrace, Memtool, Code Coverage |
| Hardware | UAD2pro / UAD2next / UAD3+ (3 models) |
Software functions (debug)
| Debug | HLL (C/C++/Rust) + assembler cross-debugging, Mixed Mode, syntax highlighting |
|---|---|
| Multicore | System-centered UI, color coding per core, synchronized run control, Multi-Program Loader |
| Special cores | Supports special cores such as GTM / PPU / SCRM / HSM / eTPU |
| Runtime observation | Real-time observation of application data with advanced visualization |
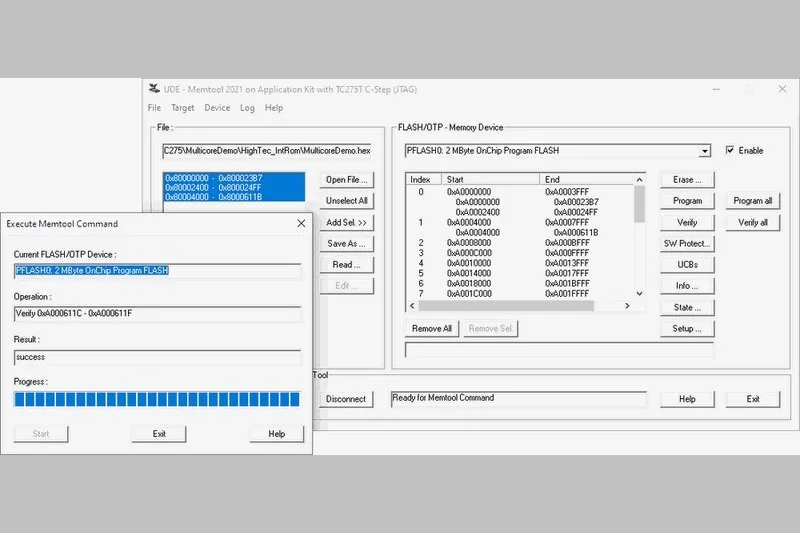
| FLASH | Integrated on-/off-chip flash programming (Memtool add-in) |
| UI | Perspectives, multi-screen, home screen, predefined target configurations |
Software functions (trace and analysis)
| Trace methods | MCDS, AURORA (AGBT/SGBT/HSSTP), Nexus, CoreSight (ETM/PTM/ITM/FTM), ARC SmaRT |
|---|---|
| Configuration | GUI configuration with UEC (Universal Emulation Configurator) |
| Analysis | Code Coverage (ISO 26262 structural coverage), Profiling, Execution Sequence, Call Graph |
| Reconstruction | Reconstructs time-aligned program flow from trace |
| Output formats | Raw / UTF (binary / text / HTML), VCD, TAB/SPACE, XML |
Software functions (automation and IDE)
| Object Model | COM-based API (included with all base licenses at no extra cost) |
|---|---|
| Scripting | Python / PowerShell / JavaScript / Perl / Visual Basic / C# / C++ (COM-capable languages) |
| Python | Embedded Python 3.12 interpreter (Script Console, auto-completion, external scripts) |
| Eclipse | Eclipse integration (dedicated debug perspective, all architectures, no extra cost) |
| Compilers | HighTec/GNU, Tasking, Keil/Arm, Wind River, Green Hills, Renesas, CodeWarrior |
RTOS and AUTOSAR Awareness
| RTOS | PXROS-HR, SAFERTOS, FreeRTOS, Sciopta, OSEK/ORTI, PXROS, CMX, uC/OS-II, rcX, Keil RTX, Nucleus PLUS |
|---|---|
| AUTOSAR | AUTOSAR Classic Platform, ARTI/ORTI support |
| ARTI | Trace and visualize tasks / runnables / ISRs from the ARTI file (arxml) |
| Display | Visualize RTOS / AUTOSAR objects and states; jump to each window |
AUTOSAR ARTI in detail
| What is ARTI? | An interface between build tools and debug/trace tools. All debug information is stored in the arxml |
|---|---|
| Support Window | Detailed display of OS objects (updated in HALT state) |
| Information classes | ArtiHook/OSClass/AlarmClass/ContextClass/IsrClass/MessageContainerClass/RessourceClass/StackClass/TaskClass/CoreClass |
| Task trace | Trace task execution, category 2 ISRs, and functions (based on ARTI hooks) |
| ArtiHookGenerator | CLI tool that automatically generates ARTI.c / ARTI.h (hook macros) at build time |
| Third-party integration | Export trace as ASAM MDF → to timing analysis tools |
| Vector Timing Bundle | Scheduling trace integration for MICROSAR (with TA Tool Suite) |
Supported MCUs (by manufacturer, combined)
| Infineon | AURIX TC4x/TC3xx/TC2xx, TriCore AUDO, XMC7xxx/4xxx/1xxx, TRAVEO T2G, PSoC 4, XC166/XC2000/XE166, C166/ST10, MOTIX |
|---|---|
| STMicroelectronics | Stellar SR6P/SR6G/SR5E, STM32 (all Cortex-M), SPC56x/SPC57x/SPC58x |
| NXP | S32G2/G3, S32V, S32Z/S32E, S32N5, S32K1/K3/K5, i.MX RT, MPC56xx/57xx, S32R, Kinetis |
| Renesas | RH850 (U2A/U2B/U2C, C1/D1/E1/E2/F1/P1), R-Car, RA, RZ/T2M, SuperH SH-2A |
| Arm (various vendors) | Cortex-R52(+), Cortex-A5x/A7x/A8/A9, Cortex-M0/3/4/7, M33/M23/M55/M52/M85, Arm7/9/11 |
| Texas Instruments | Jacinto (TDA4/DRA8), Sitara (AM64x/AM263Px/TMS570), MSPM0 G, MSPM33 |
| Synopsys | ARC EM/EV/HS, ARC-V |
| IP cores / others | Bosch GTM, DFA, Andes D23, RISC-V, SiFive, AMD/Xilinx Zynq-7000, Hilscher NETX 90, XScale |
| Chinese vendors | Tongxin Micro THA6, Thinktech Alioth TTA8, NOVOSENSE, GigaDevice, C*Core |
Learning UDE from videos (key points from 5 videos)
| ① Trace-based debugging and runtime analysis | On-chip trace is a powerful way to analyze real-time applications without affecting runtime behavior (non-intrusively). Using the MCDS (Multi-Core Debug Solution) trace system of Infineon AURIX as an example, the video demonstrates how to get started with trace-based debugging. It explains how to identify performance bottlenecks with trace and how to find bugs caused by timing problems and parallel execution. The central theme is time-accurate reconstruction of program flow. |
|---|---|
| ② Overview of the debug and trace tools | An introduction to UDE as a debug, trace, and test tool (about 40 minutes). In three parts — (1) supported microcontrollers (AURIX/TriCore, Power Architecture, Arm Cortex, RH850, and more), (2) the debugger hardware, the Universal Access Device family (UAD2pro / UAD2next / UAD3+), and (3) an overview of UDE's functions — it gives the overall picture needed to choose tools. |
| ③ Debug automation with Python | How to use UDE's automation interface from Python (about 37 minutes). Through the UDE Object Model (a software API based on Microsoft COM), Python scripts control the target system, read target state and manipulate it (for example rewriting variables). UDE has a built-in Python 3.12 interpreter (Python Script Console) for both interactive and external script execution. It applies directly to automating routine daily work and tests. |
| ④ Multicore debugging of Arm Cortex-A/Cortex-R SoCs | Debugging heterogeneous multicore SoCs with Arm Cortex-A53 / Cortex-R52 (about 23 minutes). Using the NXP S32 Automotive Platform (S32G, S32S) and ST Stellar as examples, it demonstrates UDE's multicore functions (synchronized core start/stop, core groups, and multicore breakpoints) and basic multicore trace. |
| ⑤ Visualizing variables (Visualizing Variables 101) | An explanation of UDE's extensive variable-visualization functions (about 21 minutes). It demonstrates from the basics how to observe and visualize target variables in various ways — watch, memory, and graphical displays. Practical content for following running application data in real time. |
Main uses
- Debug and trace the target MCU in a single environment
- Combine execution control, variable observation, and trace analysis
- Standardize the debug environment within the team
Benefits
- Hardware and analysis functions are integrated, so setup takes little effort
- Analyze without switching back and forth between debugging and trace
- Can be controlled from scripts and extended to automation
Environment
- Supported cores: Infineon TriCore / AURIX and other multicore SoCs
- Functions: debug / flash / trace (MCDS) / RTOS Awareness
- Hardware: UAD (Universal Access Device)
Frequently asked questions
We cannot connect to the target via XCP. What do we need?
We press the “Program” button every time we load a new ELF into flash. Can this be automated?
The flash download pattern sometimes differs between ELF and HEX. Why?
How do we debug our own bootloader that starts from flash and copies itself to RAM?
How do we install UDE in an Eclipse environment and debug?
Why is program loading slow when the files are on a network drive?
What is the quickest way to enable or disable all breakpoints at once?
Why does the Memory/SFR view show “????????”?
What if we get the “Runtime components are older than required” warning, or a crash from a context menu?
Solutions that include this product
This product is part of the following configuration combining several products. See each solution page for its place in the overall configuration.
- AURIX multicore automotive ECU development— Role of this product: coreTriCore/AURIX — multicore debugging × MCDS trace × AUTOSAR
PLS debug probe products
Related products
Contact
Tell us your target MCU, quantity, and safety requirements, and we will propose the best configuration with a rough estimate.
UDE — the standard for AURIX / TriCore multicore debugging
See all PLS products →