

 TRACE · Trace / runtime analysis
Overview
Percepio Tracealyzer is a trace-analysis tool that visualizes the runtime behavior of RTOS and Linux systems. A lightweight instrumentation library (TraceRecorder) built into the target records events such as task switches, kernel API calls, blocking, and timeouts.
More than 30 graphical views analyze CPU load, stack/heap usage, dependencies between tasks (communication flow), and more from many angles. In some cases debugging has been made up to 10 times faster, and it is used by BMW, ABB, Endress+Hauser, and others.
It supports both snapshot (RAM buffer) and streaming (long recordings) modes, with transfer over J-Link RTT, ITM, TCP/IP, USB CDC, and more.
Visualizes RTOS/Linux runtime behavior in more than 30 views. Analyzes tasks, interrupts, CPU load, and stack/heap.
Positive ONE Group supports you in Japanese, from product selection and quotes through to technical support during deployment, and proposes the optimal configuration for your target MCU, OS, quantity, and application.
Key specifications
| Visualization | 30+ views (trace / CPU load / stack / communication flow and more) |
|---|---|
| Supported OS | FreeRTOS / Zephyr / ThreadX / PX5 / VxWorks / Linux and others |
| Capture method | Snapshot / streaming |
| Transfer | J-Link RTT / ITM / SWO / TCP/IP / UDP / USB CDC |
| Host | Windows / Linux (x86-64) |
| Expansion | Can be integrated with any C/C++ code or RTOS using the Tracealyzer SDK |
Main functions
We introduce Tracealyzer's main visualization functions with real analysis screens, noting what kind of bug each one helps find. These views are common to all supported operating systems.
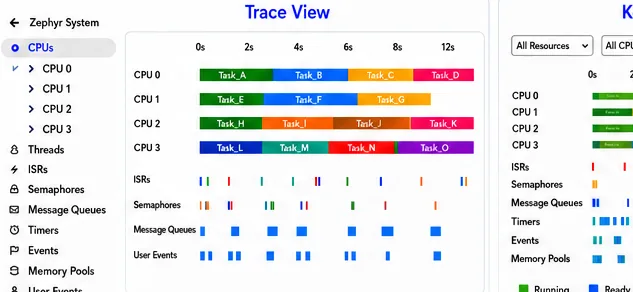
Task execution trace
Visualizes tasks/threads, interrupts, kernel API calls, and user events on a timeline. You can see at a glance whether scheduling is as intended and find priority inversion, unexpected preemption, and missed tasks.
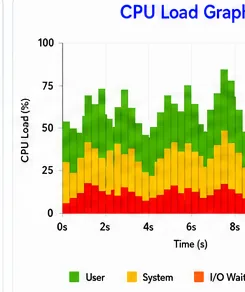
CPU Load Graph
Shows CPU usage per task/interrupt and total load over time. Identify high-load hot spots to focus optimization, and trace load spikes to blocked processing, busy loops, or excessive interrupts.
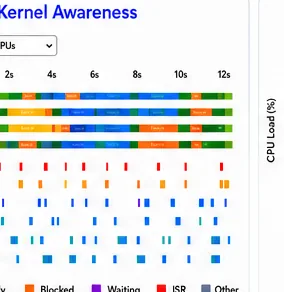
Kernel awareness
Visualizes state transitions (Running / Ready / Blocked / Waiting) of RTOS objects such as semaphores, mutexes, message queues, and event flags. You can see which task is waiting on which resource, leading directly to the causes of deadlocks, long blocking, and priority inversion.
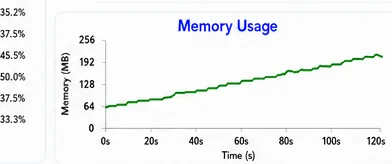
Heap / stack analysis
Shows dynamic memory allocation (malloc/free) and per-task stack usage over time. A steadily rising heap reveals memory leaks, insufficient stack margin warns of stack overflow early, and fragmentation trends become visible.
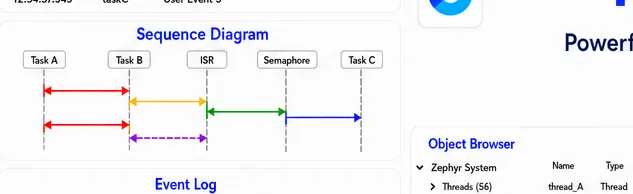
Communication flow / sequence
Summarizes the interaction of IPC and synchronization events between threads in a sequence diagram. You get an overview of which tasks communicate through which queues or semaphores, making unexpected dependencies, excessive message round trips, and missed synchronization visible.
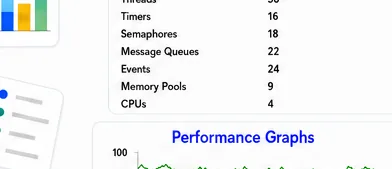
Trace statistics and timing
Compiles statistics on timing metrics such as execution time, response time, and period, shown with performance graphs. Click a maximum or minimum outlier to drill down to that job and reach problem spots such as worst-case latency, jitter, or period irregularities immediately.
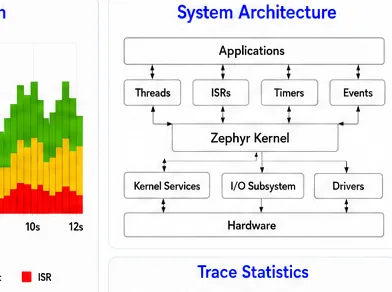
System configuration
Gives an overview of the hierarchy of application, kernel, drivers, and hardware. Seeing the whole system and how the layers relate helps isolate which layer a problem occurs in.
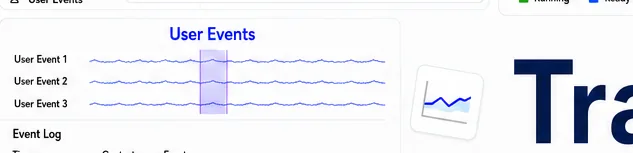
User events / live
Shows any data recorded with user events over time, and displays long traces in real time over J-Link RTT, ITM, TCP/IP, UDP, and more (hundreds of times faster than printf). Snapshot mode is also supported, and long streaming captures intermittent bugs that rarely reproduce.
All functions (visualization views and general functions)
Tracealyzer provides RTOS-aware event tracing and is known as a pioneer of trace visualization. Many visual overviews show the whole picture of system behavior, making anomalies obvious at a glance. The views are linked, and double-clicking drills down to details (host: Windows / Linux x86-64). Real screens of the representative views are shown in the section above.
Shows thread execution, interrupt handlers, kernel API calls, and user events on a timeline. Check that threads behave as expected and priorities are appropriate.
Shows CPU time per task/thread and interrupt handler and total usage. Identify the hot spots where optimization has the most effect.
A list of recorded kernel and user events. Easy to search and filter; double-click to highlight the point in the Trace View.
Summarizes the interaction of IPC and synchronization events between threads. See which threads use specific RTOS objects (mutexes, semaphores, queues).
Visualizes data recorded with user events in time-series plots. Logging with user events is hundreds of times faster than printf, allowing large volumes of low-overhead logging.
Shows dynamic memory allocation (malloc/free) over time. Use it to optimize heap size and check for memory leaks. Double-click to go to the allocation.
Plots the unused stack of each thread over time. Check the safety margin that avoids stack overflow without wasting RAM.
Shows maximum execution time, response time, and more per thread job. Double-click an extreme value to go to that job and identify latency bottlenecks.
Plots execution time, response time, period, and more per job. Get an overview of timing variation, which is important for reliability and testability.
Measures and visualizes the time between two events in the code, across threads and interrupts. Generates statistical reports and variation plots.
Visualizes recorded state transitions in the Trace View and a state diagram. States can be profiled like intervals.
Profiles code sections within a single thread (key functions, switch branches etc.). Shows execution time within the thread excluding preemption.
Generates and exports reports on thread timing, custom intervals, states, and runnables. Click Min/Max values to show the instance.
Plots metrics such as IPC message latency, IPC blocking time, dynamic priority changes, queue usage, and service-call frequency.
Fast search with event-log filters and Ctrl-F auto-completion. The Finder window lists all matches with SQL-like queries; double-click to highlight.
Supported operating systems and platforms
| Operating systems supported out of the box | FreeRTOS / Zephyr / ThreadX (Eclipse ThreadX) / PX5 RTOS / SafeRTOS / LynxOS-178 / VxWorks / Linux |
|---|---|
| Bare metal | C/C++ projects without an RTOS can also be instrumented (Bare-Metal option) |
| Extension to other operating systems | The Tracealyzer SDK allows integration with other operating systems and extension to full-stack observability |
| Instrumentation library | Percepio TraceRecorder (GitHub, Apache 2.0). No kernel modification needed, just a rebuild |
| Supported processors | STM32 / NXP i.MX RT / Xilinx Zynq / other Arm devices / ESP32 and more. From 32-bit MCUs to 64-bit multicore SoCs |
| Compilers | Any C/C++ compiler, such as GCC / Clang / IAR Embedded Workbench |
| Tool integration | Arm Keil µVision / IAR / SEGGER J-Link / STM32CubeIDE / Espressif ESP-IDF / Lauterbach |
| SMP | Supports unified tracing of multicore SMP systems (a single kernel managing multiple cores) |
Getting-started guides (by platform)
After installing Tracealyzer, add instrumentation to the target. Most integrations are based on Percepio TraceRecorder and take only a few minutes. The following guides are available for your platform.
| Bare Metal | For C/C++ projects without an RTOS |
|---|---|
| FreeRTOS (standard) | Standard FreeRTOS integration |
| FreeRTOS ESP-IDF (ESP32) | For Espressif ESP32 / ESP-IDF |
| Linux (LTTng) | Tracing Linux systems |
| ThreadX | For Eclipse ThreadX |
| PX5 RTOS | For PX5 RTOS |
| Wind River VxWorks (wvLib) | For VxWorks |
| Zephyr | For Zephyr RTOS |
| Host environment | Windows / Linux (macOS not supported). Activate with a license key after installation |
| Integration method | Snapshot (ring buffer in target RAM) / live streaming (continuous transfer) |
Data capture and streaming
| Modes | Snapshot (RAM buffer) / continuous streaming |
|---|---|
| Transfer interfaces | J-Link RTT / ITM / SWO / TCP/IP / UDP / USB CDC |
| Acceleration | UDP streaming (higher throughput and lower load than TCP, from v4.7) |
| Compact logging | Strings recorded as address references and resolved from the ELF (low overhead) |
| Debuggers | SEGGER J-Link / IAR I-jet / Keil ULINK |
Instrumentation API (how to use)
| Kernel instrumentation | Adds lightweight instrumentation to existing hooks (task switches, APIs, blocking) |
|---|---|
| User events | Record variable values, states, and intervals with a C API (hundreds of times faster than printf) |
| runnable | ECU profiling with AUTOSAR runnable trace (from v4.7) |
| State machines | Explicitly instrument state machines and custom intervals with the TraceRecorder API |
Product editions
| Percepio View | Basic trace views (free entry level) |
|---|---|
| Percepio Profile | View + J-Link RTT streaming + profiling |
| Tracealyzer | All features (long traces, all streaming methods, all analyses) |
License model
Tracealyzer is offered as an annual subscription. Every subscription includes technical support, maintenance updates, and major version upgrades at no extra charge during its term.
| Single-user | A node-locked license tied to one development workstation. Ideal for individuals and small teams. Valid for one year, including support and software updates. |
|---|---|
| Floating server | A license shared by a team (with a limit on concurrent users). Managed by a local license server (PercepioLM, Windows/Linux) or the cloud Percepio License Service (PLS). |
| Academic | Non-commercial license for education and academic research (on request). Full functionality (contact us for terms). |
| Evaluation | A time-limited full-function evaluation is available. When it ends, the limited Free Edition (equivalent to Percepio View) is activated automatically. |
| Detect licensing | Percepio Detect is an annual floating-server subscription, with capacity tiers by number of connected test targets. |
Development tool integration
| IDE | Eclipse/GDB, STM32CubeIDE, Keil MDK, IAR EWARM, Lauterbach |
|---|---|
| VS Code | Percepio TraceExporter for VS Code (snapshot export) |
| Host OS | Windows / Linux (x86-64) |
| Used by | BMW / ABB / Endress+Hauser / WITTENSTEIN and others |
Main uses
- Visualize the execution order and duration of task switches and interrupts on RTOS / Linux
- Identify the causes of priority inversion, deadlocks, and slow responses in RTOS / Linux devices
- Track down rarely reproducible bugs from recordings
Benefits
- Ready-made for RTOS / Linux, so instrumentation takes little effort
- Shows runtime behavior you cannot see just by reading source code
- Track down timing bugs that disappear when the system is halted, while it keeps running
Frequently asked questions
Can we get a quote or technical advice on Tracealyzer?
Solutions that include this product
This product is part of the following configuration combining several products. See each solution page for its place in the overall configuration.
- RTOS observability and runtime analysis— Role of this product: coreRuntime visualization × trace capture × anomaly detection after shipment
Environment and specifications
| Overview | Visual trace diagnostics for RTOS/Linux-based embedded software. More than 30 views |
|---|---|
| Supported platforms (official list) | FreeRTOS, SafeRTOS, Zephyr, ThreadX, PX5, Cesium RTOS, LynxOS-178, On Time RTOS-32, OpenVX / Synopsys EV6x, VxWorks, Linux (LTTng), bare metal / SDK (any RTOS) |
| IDE integration | IAR Embedded Workbench, Keil µVision (MDK), Microchip MPLAB X, Wind River Workbench, STM32CubeIDE and others |
| Processors | STM32, NXP i.MX RT, Xilinx Zynq, and other Arm devices, ESP32, etc. Unsupported processors can be ported with a few lines of code |
| Method | No dedicated hardware required. Events are recorded with software instrumentation and streamed to the host, or held in target RAM (snapshot) |
| Evaluation | Evaluation license: 10 days (free) |
Percepio trace and runtime analysis products
- Percepio View for Zephyr
- Tracealyzer Bare Metal support
- Tracealyzer for Cesium RTOS
- Tracealyzer for Linux
- Tracealyzer for LynxOS-178
- Tracealyzer for On Time RTOS-32
- Tracealyzer for OpenVX
- Tracealyzer for PX5 RTOS
- Tracealyzer for SafeRTOS
- Tracealyzer for ThreadX
- Tracealyzer for VxWorks
- Tracealyzer for Zephyr
- Tracealyzer for µC/OS
Try it first with a demo loan or free evaluation
You can try the full-function evaluation version free of charge (sample traces included).
Request a demo loan or free evaluation →Contact
Tell us your target MCU, quantity, and safety requirements, and we will propose the best configuration with a rough estimate.
Tracealyzer — the pioneer of runtime visualization
See all Percepio products →